Grafana
CedarDB is compatible with Grafana, the popular dashboard building solution. You can use Grafana’s PostgreSQL connector to visualize the data stored in CedarDB.
Set up Grafana
Install Grafana
Install Grafana according to its official documentation. For example, if you are using Ubuntu, use this guide.
Start the Grafana server
Again, use the corresponding page of the official documentation.
Make sure everything works
Use this page of Grafana’s documentation to test your installation and ensure it set it up correctly.
Optional: reduce refresh interval
By default, Grafana refreshes its dashboard at most once every 5 seconds.
If you want to update your dashboards more often, open /etc/grafana/grafana.ini in your favorite text editor:
min_refresh_interval = 100msAfterwards, restart Grafana to load the setting:
sudo systemctl restart grafana-serverYou can then choose your own refresh intervals within your dashboard: Within your dashboard’s setting menu, under the general tab, set the Auto refresh setting to e.g. 100ms,200ms,500ms,1s,5s,10s,30s,1m,5m.
Set up CedarDB
Now that Grafana is up and running, we have to start a CedarDB instance it can connect to.
Start CedarDB
docker run --rm -p 5432:5432 -e CEDAR_PASSWORD=test --name cedardb_test cedardbConnect via psql and create a Grafana user
Connect to CedardB via psql:
psql -h localhost -U postgresCreate a new user for Grafana:
create user grafana;
alter user grafana with password 'grafana';
create database grafana;
\c grafana -- switch to the grafana database. Re-run this if you have to reconnect with psql later on.
Create and populate a schema
Let’s create some dummy data so we can see Grafana in action:
create table test(time timestamptz, value int);
insert into test values(current_timestamp, (random() * 100)::int);
\watch 1 -- this command re-executes the last command every second - we now get live updates!
Build a dashboard in Grafana
Add a new data source
Within Grafana (e.g. on https://localhost:3000/), navigate to: Main Menu > Connections > Data sources > Add new data source
Choose “PostgreSQL”, and fill in the following settings:
Name: cedardb
Host URL: localhost:5432
Database name: grafana
Username: grafana
Password: grafana

TSL/SSL Mode: disable
PostgreSQL Version: 15
Min time interval: 100ms
Then click on “Save & test”. You will get an error message “Internal Server Error” with the message ERROR: schema "information_schema" does not exist in the CedarDB logs. This is expected behaviour and fine for now.
Build a dashboard
On the top right of the data source window, click on “Build a dashbaord”, and then “Add visualization”. Choose your new “CedarDB” data source.
In the Query builder, toggle the “Code” view on the far right and enter the statement
select * from test;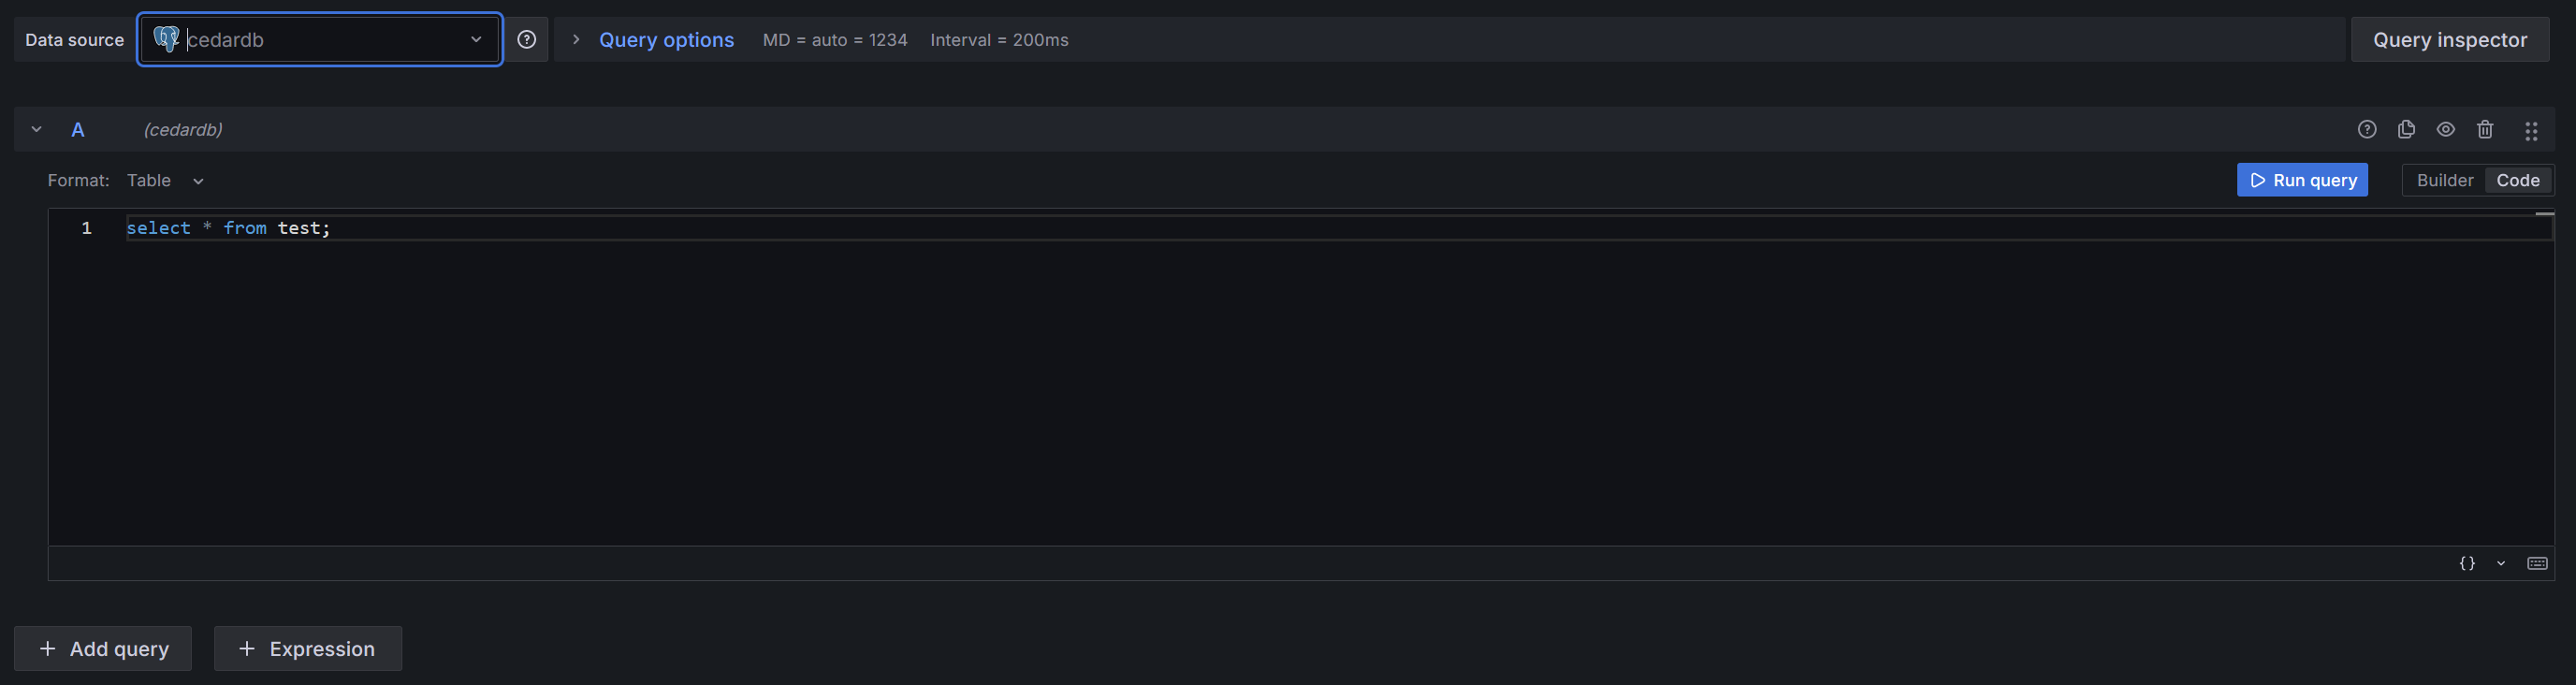
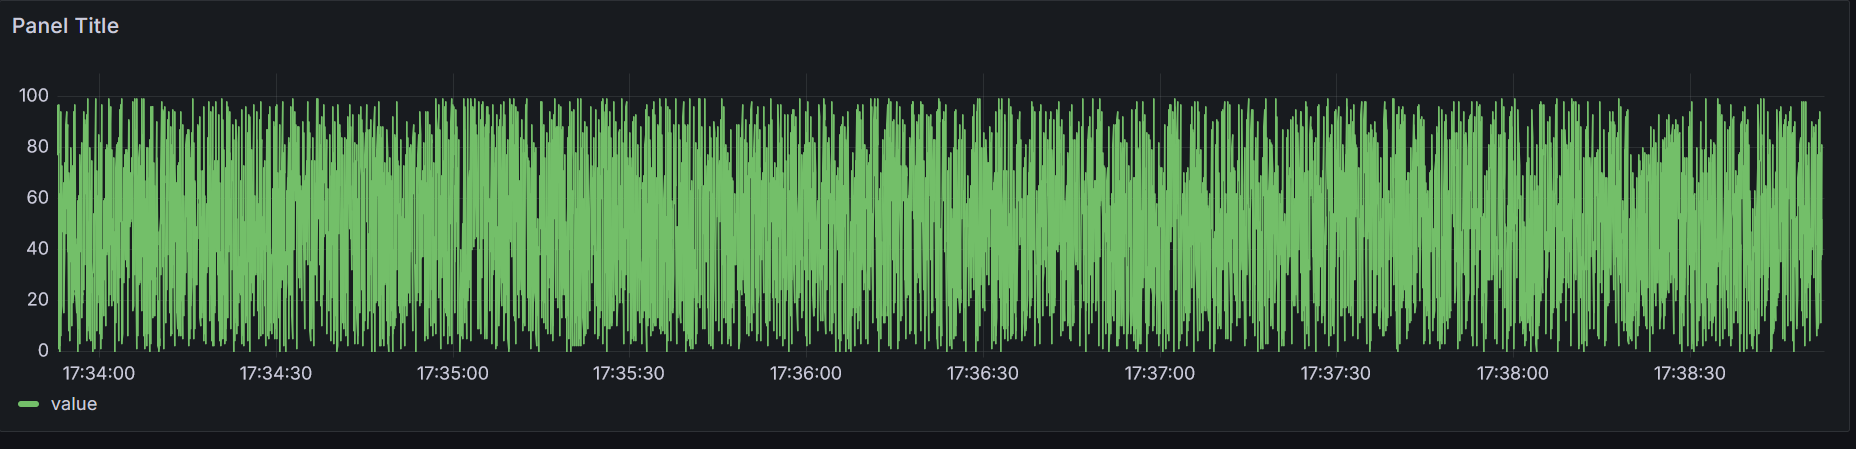
When choosing the correct interval (e.g., “Last 10 minutes”) you should see an automatically updating live view of your data. Apply the changes on the top right to get a view of your new dashboard.
Fiddle with the refresh intervals
If you have changed the minimum refresh interval of Grafana earlier, you can set the auto refresh interval in the top right to a lower value (e.g., 100ms). Rerun your watch command in your psql shell:
insert into test values(current_timestamp, (random() * 100)::int);
\watch 0.05
to get a more responsive Grafana.
Next Steps
Use more sophisticated data (maybe from on of our sample datasets?) or take a look at the Grafana docs to see which kinds of visualization are possible.
